User Guide of BioMorph v3
Modular Structure of the BioMorph

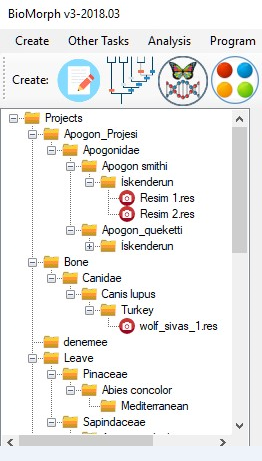
BioMorph has a user friendly graphical user interfaces which is shown in the following pictures The users can see all created project list at the left side of the interface
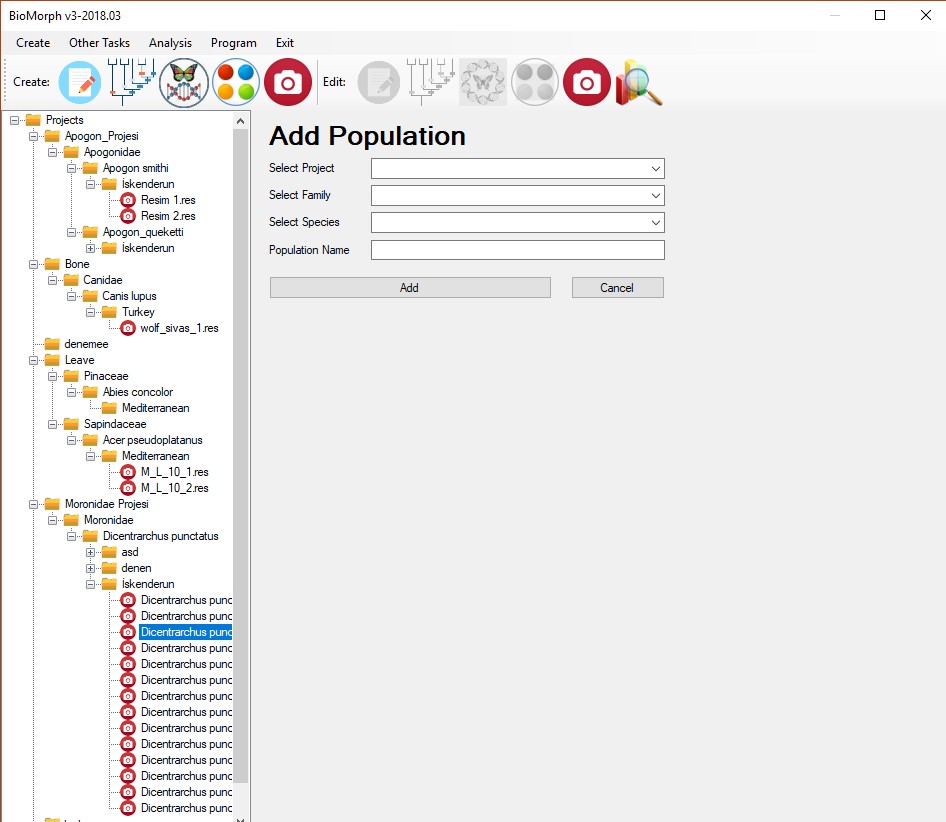
The user interface of the software consist of two sides: left side is the Project Tree tab showing the project and its contents as a tree structure
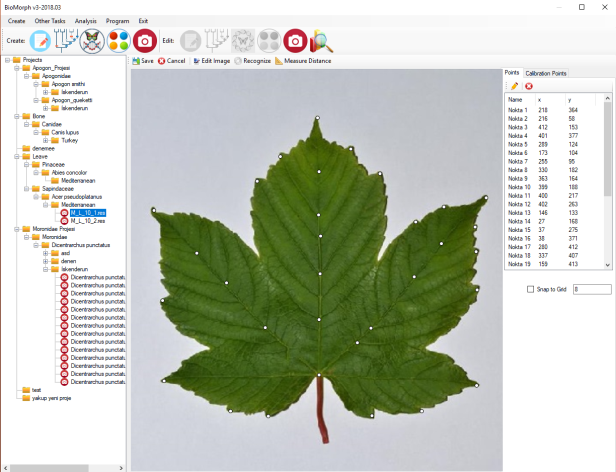
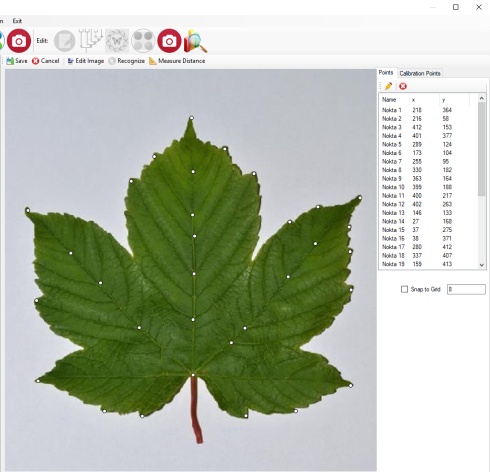
Right side of the interface display the processed section
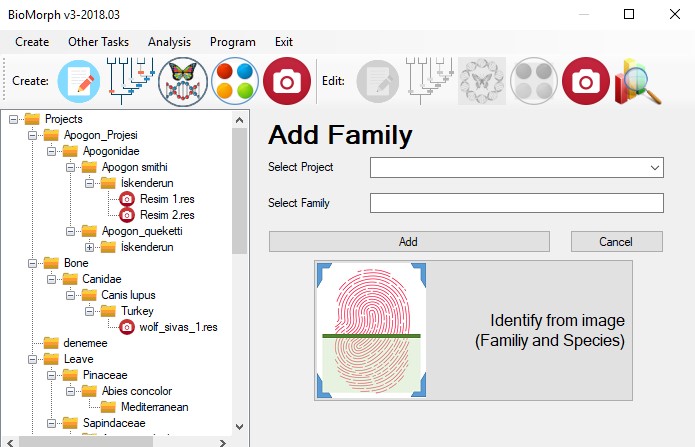
The tool bar section of the software is used to create new project and add new family, new species, new population and new sample bio-object

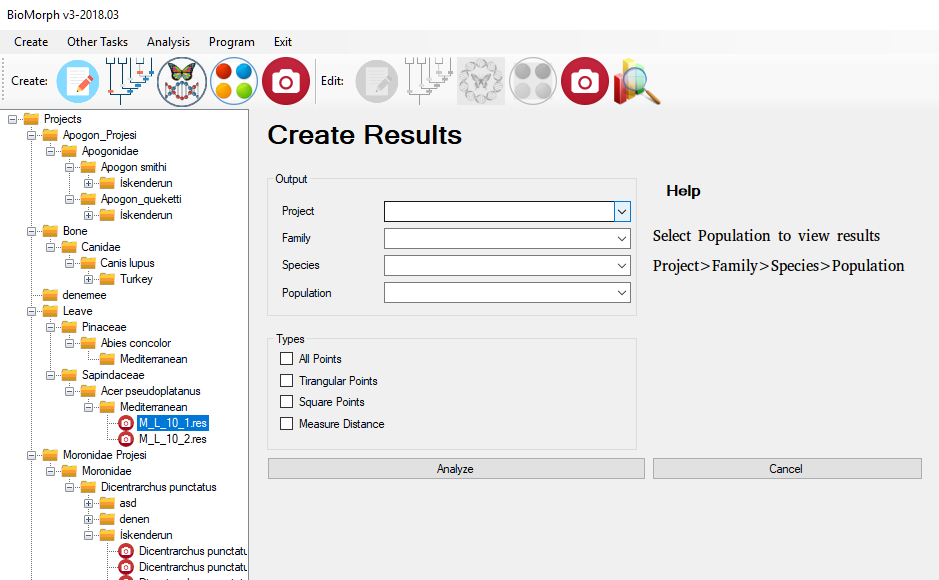
The last button is used to show result of calculation
